Bitcoin ‘close to breakout’ as this formation puts next target at $320,000
Amid Bitcoin’s (BTC) struggle to break past $70,000, a crypto technical analyst has stated that recent price movements suggest that the digital asset has the potential for a massive breakout.
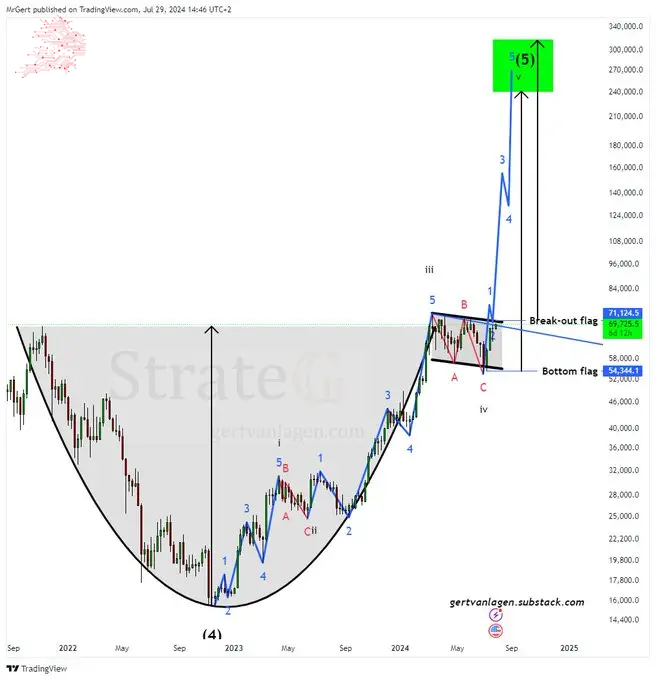
Particularly, in an X post on July 29, the analyst, Gert van Lagen, noted that Bitcoin appears to be on the verge of a significant breakout, with its next potential target ranging between $240,000 and $320,000.
This bullish outlook is highlighted by a compelling “Cup & Handle” formation on Bitcoin’s weekly chart. Notably, this pattern is typically seen as a bullish continuation pattern, indicating that the price is likely to continue in its current trend. In this case, Bitcoin’s price has formed a large, rounded bottom (the “cup”), followed by a consolidation period (the “handle”), which suggests an impending breakout.
Picks for you
A crucial aspect of this analysis is the Elliott Wave theory, which is applied to price movements. The analysis shows a clean i-ii-iii-iv-v Elliott wave sequence, the lower-order fractal of the larger (4)-(5) wave. This sequence suggests that Bitcoin is completing a five-wave pattern, which typically indicates a strong trend continuation.
Bitcoin price levels to watch
According to Lagen, the key levels to watch are the bottom of the flag at around $54,344.11 and the breakout point at approximately $71,124.50. These points are used as the measuring criteria to determine the target range of $240,000 to $320,000.
Notably, if the price breaks out from the handle of the cup and surpasses the $71,124.50 level, it could set the stage for a monumental rally towards the $320,000 mark. This potential breakout would mark a significant milestone in Bitcoin’s price history and could attract a new wave of institutional and retail investors.
Indeed, despite Bitcoin’s initial bullish march towards $70,000, the maiden crypto was derailed by a possible influx of capital into the market. Following the overhang from payouts to creditors of the defunct Mt. Gox cryptocurrency exchange, the recent downturn came after significant transfers of Bitcoin from a wallet reportedly belonging to the US government.
The supposed government wallet transferred $2 billion of Bitcoin to an unidentified wallet. The nearly 28,000 Bitcoin, valued at over $2 billion, appears to be tied to funds the US Department of Justice previously confiscated from the defunct dark web market Silk Road.
Initially, Bitcoin was riding a bullish wave after Republican presidential nominee Donald Trump promised to add the crypto to the US Treasury if reelected.
Bitcoin price analysis
At the time of writing, Bitcoin was valued at $66,702, reflecting daily losses of over 4%. On the weekly timeframe, Bitcoin is up almost 1%.
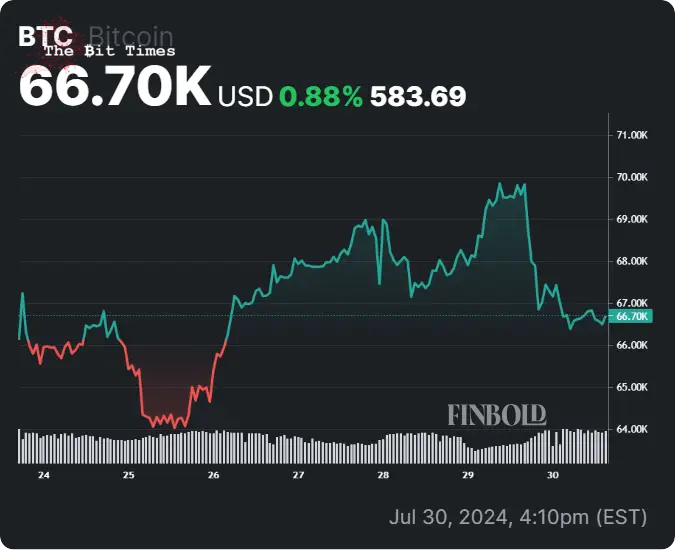
At the moment, fears are that if Bitcoin plunges below the $66,000 mark, the crypto might experience a free fall below $65,000.
Disclaimer: The content on this site should not be considered investment advice. Investing is speculative. When investing, your capital is at risk.
Comments
Post a Comment