Bitcoin Price Prediction for Today, March 25: BTC/USD Short-term Bears Target at $27k
Join Our Telegram channel to stay up to date on breaking news coverage
The Bitcoin price prediction shows that BTC is falling again in a narrow channel after consolidating, but buying interest could play out.
Bitcoin Prediction Statistics Data:
- Bitcoin price now – $27,452
- Bitcoin market cap – $527.3 billion
- Bitcoin circulating supply – 19.3 million
- Bitcoin total supply – 19.3 million
- Bitcoin Coinmarketcap ranking – #1
BTC/USD Long-term Trend: Bullish (Daily Chart)
Key levels:
Resistance Levels: $33,000, $35,000, $37,000
Support Levels: $22,000, $20,000, $18,000
During the European session today, BTC/USD started trading from the opening price of $27,708 and now dropping below the support level of $27,500 at the time of writing. However, the psychological barrier of $28,000 still serves as the first important resistance within the market and a sustainable move above the upper boundary of the channel may likely push the price toward the resistance level of $30,000.
Bitcoin Price Prediction: Will Bitcoin (BTC) Drop More?
On the intraday chart, the Bitcoin price breaks below the 9-day moving average, which may increase the selling pressure. At the time of writing, BTC/USD is hovering at the support created below $27,500 and if this is cleared, the sell-off may be extended to $27,000 which is around the 21-day moving average. Meanwhile, the dips to $26,000 are likely to be bought, which means the overall bullish sentiments may prevail.
Moreover, if the price moves below the mentioned support, $24,000 could come into focus which served as support during the previous consolidation period while the critical supports lie at $22,000, $20,000, and $18,000. Looking at the upside, the first resistance may likely come at $28,000 if the king coin rebounded. Once this is done, $30,000 could come back into focus. Further bullish movement may hit the potential resistance levels at $33,000, $35,000, and $37,000 as the Relative Strength Index (14) moves to cross below the 60-level.
BTC/USD Medium-term Trend: Ranging (4H Chart)
The 4-hour chart shows that the Bitcoin bears are still in play within the market keeping the Bitcoin price below the 9-day and 21-day moving averages. Although BTC/USD has not yet slipped below $27,000, it’s still in the loop of making a bounce back.
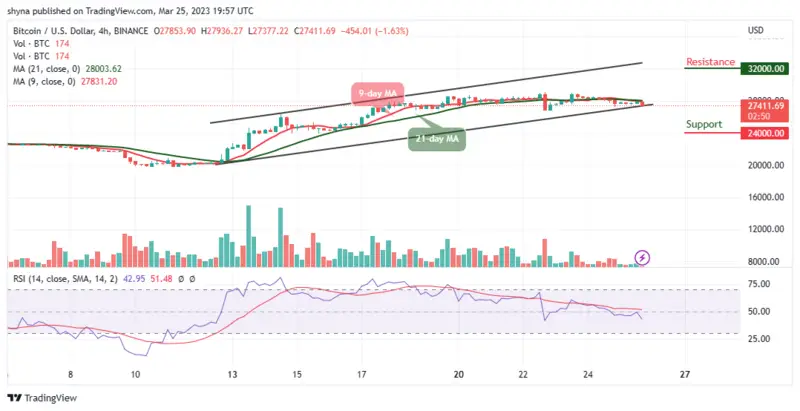
Moreover, the Bitcoin price is currently hovering below the moving averages at the time of writing. The upward movement may likely push the price to the nearest resistance of $32,000 and above while the immediate support lies at $24,000 and below. The Relative Strength Index (14) is moving below the 40-level, which indicates bearish movement.
Alternatives to Bitcoin
The Bitcoin price may resume a sideways move below the $27,500 level as the king coin trades below the 9-day moving average. The uptrend has been stalled at the recent high and the market price movement has been marginal for the past few days because of the presence of bears. On the other hand, Love Hate Inu (LHINU) is making waves in the market as the token ensures that participants have the chance to voice their opinion and find a supportive community. To vote in polls, all Love Hate Inu participants must stake their tokens. At the time of writing, LHINU tokens are in presale and almost $2m has been raised so far.
Love Hate Inu - Newest Meme Coin

- Decentralized Polling - Vote to Earn
- Early Access Presale Live Now
- Ethereum Chain
- Featured in Yahoo Finance
- Mint Memes of Survey Results as NFTs
- Staking Rewards
- Viral Potential, Growing Community
Join Our Telegram channel to stay up to date on breaking news coverage


Comments
Post a Comment